Racial Equity

The racial and ethnic demographics of southwestern Pennsylvania are changing, just as they are across the nation. The share of the population held by African American, Asian, Hispanic and other minority residents has increased since 2000 and continues to do so.
But racial and ethnic minorities accounted for less than 14 percent of the population in the seven-county Pittsburgh Metropolitan Statistical Area in 2015, which is the smallest share among the 15 Pittsburgh Today benchmark regions.
And their representation among homeowners, the region’s workforce and across other key social and economic indicators is even lower.
Housing, jobs and income
Wide gaps in homeownership and income have historically been seen when race and ethnicity is considered and little has changed in recent years.
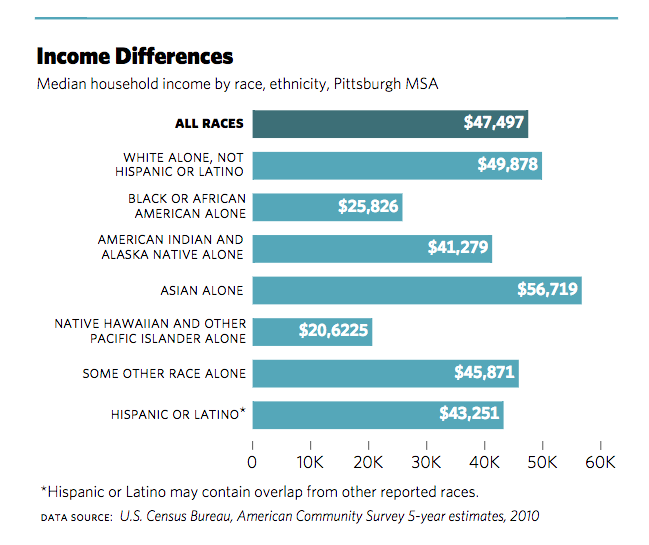
For example, only 5.8 percent of the more than 697,000 homeowners in the Pittsburgh MSA were African American, Asian, Hispanic in 2010, when they represented 12.9 percent of the region’s population, U.S. Census Bureau data suggest. And Asian residents were the only minority population with an average annual household income greater that white residents.
Three years later, racial and ethnic minorities held 11 percent of the jobs in the regional workforce while they represented 13.6 percent of the population.
The Pittsburgh Regional Quality of Life Survey also suggests there are stark racial differences among residents who are facing financial hardship. For example, nearly 18 percent of African Americans report they often or always have trouble paying for basic necessities – more than twice the rate reported by non-African American residents, according to the survey by the University of Pittsburgh University Center for Social and Urban Research.

Differences among minorities
Broad comparisons of white and minority residents across indicators tend to obscure differences among the minority groups themselves.
Asian residents, for example, had a median annual household income of about $57,000 in 2010, the highest of any racial or ethnic group in the Pittsburgh MSA, including white residents. And although they represented only 1.7 percent of the population, they accounted for almost 4 percent of residents in the region with a bachelor’s degree.
African Americans are clearly the most vulnerable to inequities across social and economic indicators. In 2010, they represented 8.3 percent of the Pittsburgh MSA population, but accounted for an estimated 4.2 percent of the region’s homeowners. And at about $25,826, their median annual household income was the lowest of any racial or ethnic group in the region.
This brief is a summary of a more detailed analysis published in the 2016 Sustainable Pittsburgh Southwestern Pennsylvania Sustainability Goals and Indicators Report.


